Insights
COVID-19 and summer bushfires: The economic impact on your suburb and pathways to recovery
Posted May 04, 2020
- Local government


Two unprecedented crises have battered Australia over the past six months: the COVID-19 pandemic and catastrophic bushfires. The subsequent economic decline across Australia is both considerable and varied. History tells us that economies can bounce back quickly after a severe downturn, so a quick recovery is possible but uncertain. Recovery could take many forms.
The COVID-19 pandemic represents the most significant challenge to Australia’s economy since the Second World War. The social distancing restrictions that have shut down large parts of the Australian economy are unprecedented. The economic uncertainty surrounding the COVID-19 shutdown, compounded by summer bushfires that wreaked destruction across many local communities, means that Australia’s Gross Domestic Product (GDP) will contract significantly in 2019-20 – the biggest contraction since the Great Depression.
In this article, we provide an estimate of GDP for 2019-20, taking into consideration the two recent crises, and show scenarios for how the Australian economy could recover from the subsequent recession. We also explore the impact these crises have on twelve local government areas and their possible path to recovery.
GDP movement varies across regions
Australia’s GDP is expected to decline by 6.7 per cent in 2019-20 compared to the 2018-19 fiscal year. This estimate is based on current information available on the summer bushfires and the COVID-19 restrictions and the likely flow-on effect on the economy. The estimated decline accounts for the various stimulus measures announced by all levels of government (as of 24 April 2020). Without these stimulus measures, Australia’s 2019-20 GDP would likely decline by over 14 per cent.
The interactive map below shows GDP forecasts for 2019-20 across Australia.
Australia’s patchwork economy
GDP movement across the country varies. While the Australian economy has not had an annual decline in GDP since 1990-91, there have been many regional recessions during this time due to the very different economic structures across the country. A patchwork economy has evolved from different population growth rates, the rise of knowledge-intensive services, differentials in government policy and investment, the resources construction boom and bust, the declining competitiveness of manufacturing among other changes. These differences can be explored in the SGS report and interactive map Economic Performance of Australia’s Cities and Regions 2018-19, which includes estimates of GDP for each major city and region in Australia.
For more than a decade, SGS has provided the only annual research into the economic performance of Australia’s cities and regions. We offer this research freely to help business, community groups and all levels of government understand how their regional and local economy is performing.
GDP is not declining everywhere
Some regions with significant mining and agriculture industries, less impacted by social distancing restrictions, have experienced some levels of GDP growth. Many local government areas (LGAs) have experienced a 2.5 and 7.5 per cent decline. LGAs that rely on tourism are likely to experience between 11 and 15 per cent decline in GDP, as a result of travel restrictions. LGAs heavily impacted by the summer bushfires could see up to 20 per cent decline in annual GDP. The purpose of this analysis is to understand the size of the shock to local economies in 2019-20 and then to understand what the recovery scenario might look like. Looking back at past recessions helps to contextualise current economic challenges better.
A quick recovery is possible but uncertain
Over the last century, there have been eight [1] events when annual GDP has declined in Australia. These recession events are shown in Figure 1.
The only two events which come close to the likely impact of COVID-19 are the First World War and the Great Depression. In 1914-15 GDP fell by 11 per cent due to the onset of the war. This dramatic fall was brought about by the halt in global trade (similar to COVID-19) which significantly disrupted day to day economic activity as workers left their jobs and enlisted into the war effort (much like the impact of social distancing).
FIGURE 1 AUSTRALIAN RECESSION EVENTS – ORDERED BY SIZE
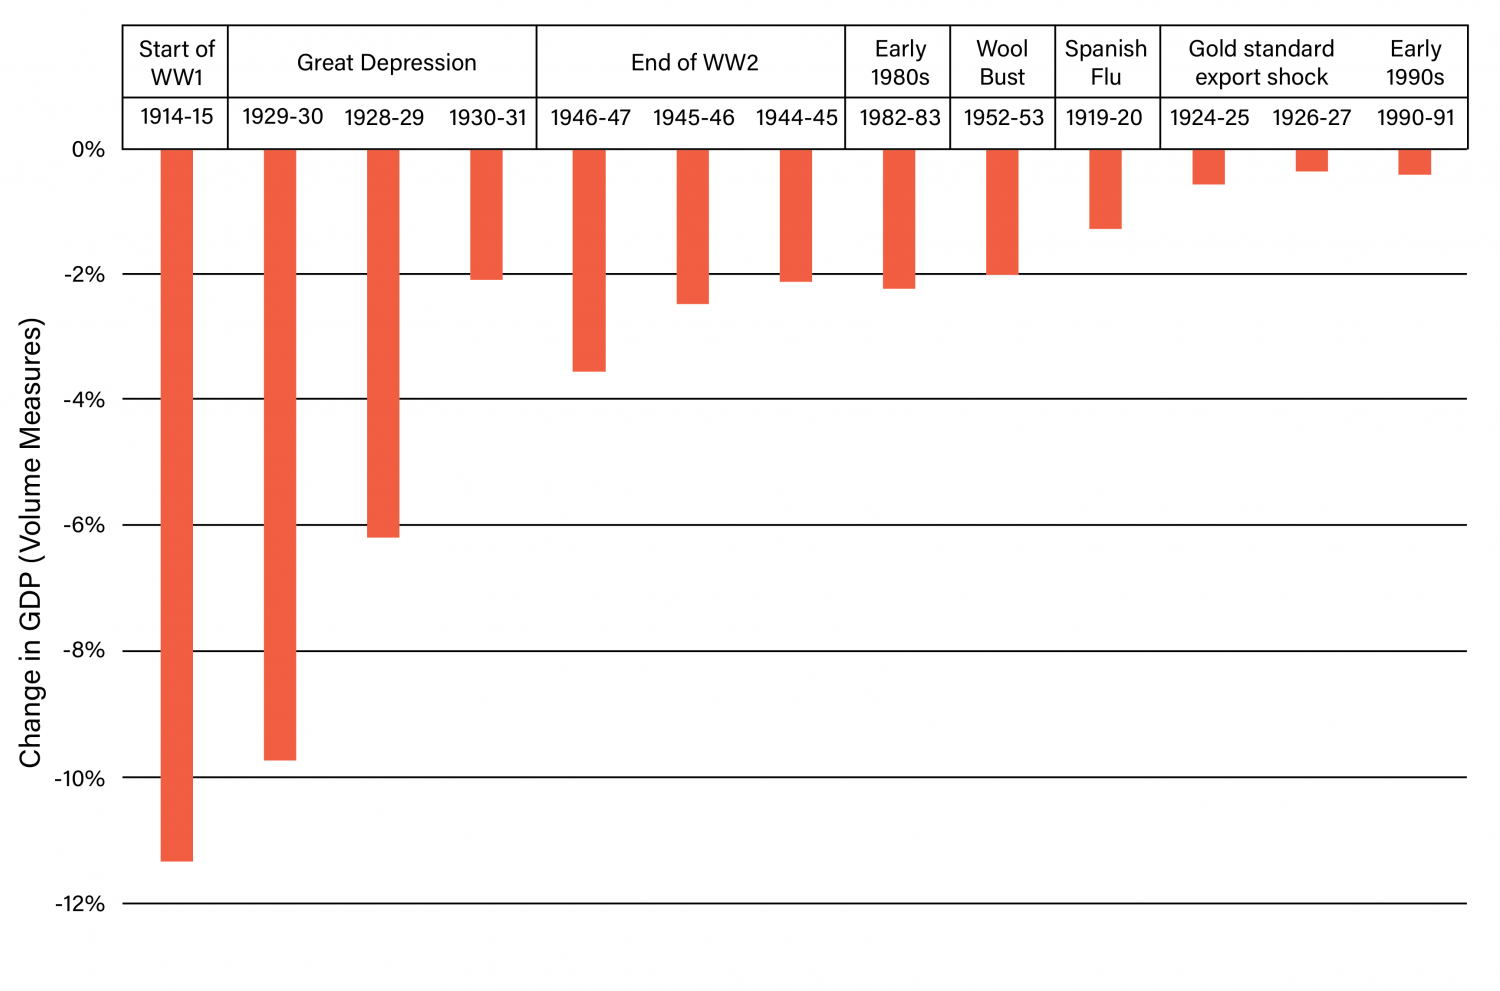

The Great Depression had three consecutive years of GDP decline. In 1928-29 GDP declined by 6.2 per cent, 1929-30 by 9.7 per cent decline and in 1930-31 GDP declined by 2.1 per cent. In total, the GDP declined by 17.1 per cent over the three years. This is the scenario that current policy makers are taking active steps to avoid.
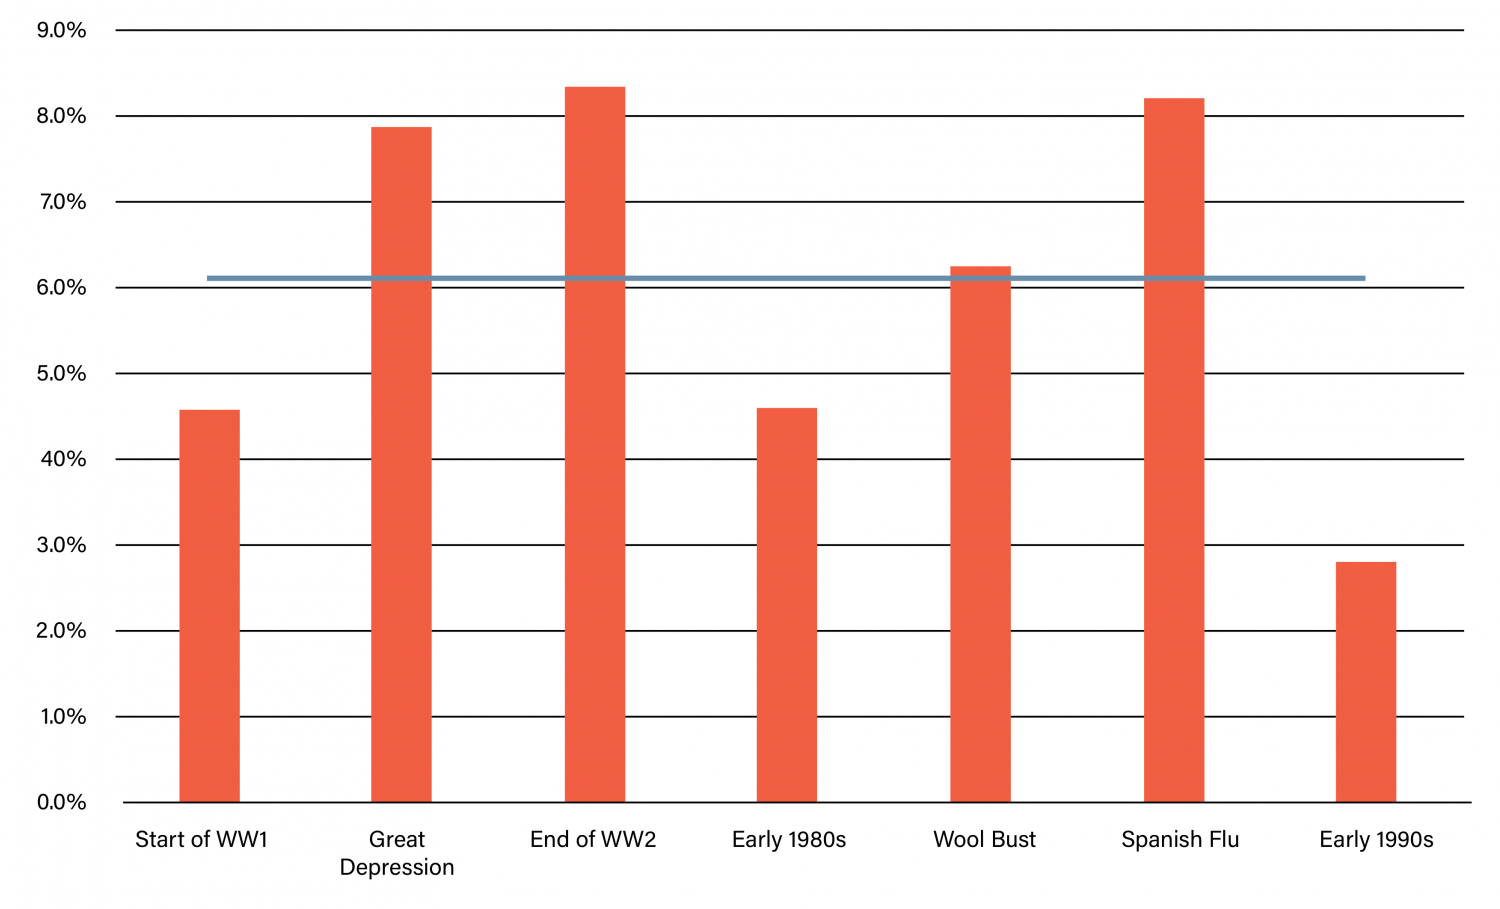
Following every major recession event, there has been strong annual GDP growth in the following three years. Figure 2 shows the average is just over 6 per cent. What we see from previous recessions is that a sharp recovery is possible, but there is massive uncertainty about what might happen over the next few years. Put simply, a fast recovery is possible but uncertain.
FIGURE 2 AVERAGE GDP GROWTH IN THE 3 YEARS FOLLOWING RECESSION EVENTS

While a 6.7 per cent decline in 2019-20 GDP compared to the previous year appears most likely, the impact could be as high as 10 per cent. Much of this variation is due to the second-round effects of social distancing restrictions which could impact the construction, manufacturing and professional services sectors.
A critical question right now is: How will the economy respond to a 6.7 per cent decline in GDP during 2019-20? Economic forecasting is difficult at the best of times. It is even harder at times like this when we are experiencing unprecedented events. So rather than focus on one set of numbers, it’s best to think about scenarios of what might happen.
Five possible recovery scenarios
The purpose of the analysis is to understand the impact the COVID-19 social restrictions and the summer bushfires have had on local economies and the path recovery may take.
These dual crises have had differing impacts across Australia. The tables below show the forecasted decline in GDP during the 2019-20 financial year for three LGAs in four types of locations:
- bushfire affected LGAs
- tourism-focused LGAs
- major airport locations
- major CBDs.
The recovery from these declines in GDP are discussed in the context of five possible recovery scenarios:
- V-shaped recovery - the economy will bounce back to where it was before the COVID-19 shock and quickly return to normal growth.
- Deeper recession - there is a larger shock to GDP and a lower bounce back.
- Longer recession - the recession takes longer for the economy to recovery.
- Very deep recession - there is a large shock to GDP and a slower bounce back 2-3 years.
- Very deep recession with slower recovery - it could take 3-4 years before the economy recovers to the 2018-19 level.
The tables below show the estimated decline in GDP compared to the 2018-19 fiscal year.
| Bushfire affected LGAs | Decline in 2019-20 GDP | GDP 2019-20 ($ Million) |
| East Gippsland (S), VIC | -22.6% | $1,466 |
| Kangaroo Island (DC), SA | -17.0% | $234 |
| Wingecarribee (A), NSW | -12.8% | $2,226 |
| Tourism-focused LGAs | Decline in 2019-20 GDP | GDP 2019-20 ($ Million) |
| Augusta-Margaret River (S), WA | -15.1% | $752 |
| Douglas (S), QLD | -12.9% | $691 |
| Byron (A), NSW | -11.8% | $1,524 |
| Locations of major airports | Decline in 2019-20 GDP | GDP 2019-20 ($ Million) |
| Hume (C), VIC | -13.3% | $11,801 |
| Belmont (C), WA | -12.2% | $5,892 |
| Botany Bay (C), NSW | -10.9% | $8,910 |
Bushfire affected regions
Due to the summer bushfires and COVID-19 pandemic, East Gippsland is likely to see a decline in annual GDP of over 22 per cent - three times the national decline. Kangaroo Island has also been severely impacted this financial year by the bushfires and the COVID-19 pandemic and will likely see a 17 per cent decline this financial year. It could be three to four years before these economies recover to the 2018-19 level.
Tourism-focused regions
Augusta-Margaret River, Douglas and Byron regions are likely to experience between 11 and 15 per cent decline in GDP as both international and domestic tourism ceased from March 2020. Margaret River LGA could recover quickly when the domestic Western Australia tourists from Perth return once restrictions are lifted – which could be in early 2020-21. Margaret River could also benefit from increased visitation from elsewhere in Australia, while international travel restrictions are in place.
Douglas LGA, which includes the resort town of Port Douglas and the Daintree Rainforest in North Queensland, could take longer to recover. It could take two to three years before the economy recovers to the 2018-19 level as Douglas relies on air travel for the bulk of its tourism numbers. Even with the return to normal domestic travel arrangements, North Queensland is not a major air travel hub, so it may be one of the last regions to recover.
Locations of major airports
The closure of domestic and international air travel has had an impact on the three LGAs which contain airports: Melbourne airport (Hume), Sydney airport (Botany Bay) and Perth airport (Belmont).
GDP declines of between 11 and 13 per cent are the result of passenger air traffic dropping by over 90 per cent. Terminal activities have mostly stopped, as have associated support services and accommodation and retail. These areas are not solely reliant on the airports, but the profile of the recovery of these LGAs will hinge on the speed of recovery in domestic and international travel.
Three major CBDs
Melbourne, Sydney and Perth CBDs are likely to see larger declines in GDP than the national average of 6.7 per cent. This large decline is due to the loss of tourism spending, the closure of cafes, bars and restaurants which were dependent on office workers and the effective closure of the major retail centres. The large cluster of higher education activities and major cultural institutions were also severely impacted by the shutdown. The economic activity in the cultural sector effectively ceased to exist from March 2020.
These areas could have a V-shaped recovery. The economy will bounce back quickly as office workers and domestic visitors return to the central cities when the restriction lift. However, the loss of higher education income from reduced international student numbers will slow the recovery process. Sydney and Melbourne will benefit from the massive store of wealth which have been built up in the past two decades of continuous growth. It may be one to two years before these local economies recover to the 2018-19 level.
These outcomes are still highly dependent on several factors, including:
- When social distancing restrictions lift and allow the services sector to return.
- The scale of ‘second round’ impacts on the construction, manufacturing and professional services industries.
- When international migration returns.
- Timing of policy responses to stimulate the economy after restrictions lift.
Download the article


More information
Subscribe to LGiU Australia and access the latest information about COVID-19 and local government’s responses across the globe. LGiU Australia is a joint venture between not-for-profit local authority think tank LGiU and SGS Economics and Planning. It is a policy information membership service dedicated to local government across Australia.
Endnote
[1] There were four occasions when Australian GDP declined in two consecutive quarters June and September quarters 1961, December quarter 1971 and March quarter 1972, September and December quarters 1975 and September and December quarters 1977. These two consecutive quarters of decline in quarterly GDP were not enough to cause a fall in annual GDP and hence these events have not been in Figure 1.
Bibliography
ABS (Australian Bureau of Statistics), Year Book Australia, (various years), cat. no. 1301.0, ABS, Canberra.
ABS, Australian System of National Accounts, 2018-19, cat. no. 5204.0
ABS, Australian National Accounts: National Income, Expenditure and Product, Dec 2019, cat. no. 5206.0
ABS, Labour Force, Australia, 2018-19, cat. no. 6202.0
ABS, Retail Trade, Preliminary, March 2020, cat. no. 8501.0.55.008
ABS Weekly Payroll Jobs and Wages in Australia, cat. no. 6160.0.55.001
Borland, J, and Kennedy, S. (1998) ‘Dimensions, Structure and History of Australian Unemployment’, Reserve Bank Conference – 1998: Unemployment and the Australian Labour Market.
Butlin, N., (1985) Australian National Accounts 1788-1983, Australian National University Source Papers in Economic History No. 6, November 1985.
Goodridge, S., D. Harding and P. Lloyd (1995), ‘The Long-term Growth in Unemployment’, Melbourne Institute of Applied Economic and Social Research, University of Melbourne, Working Paper No. 2/95
SGS Economics & Planning (2019), Economic Performance of Cities & Regions 2018-19.
Connect with us on LinkedIn
- Local government