Insights
At what cost? Mapping where natural perils impact on economic growth and communities
Posted December 19, 2018
- Local government
- State government
- Federal Government
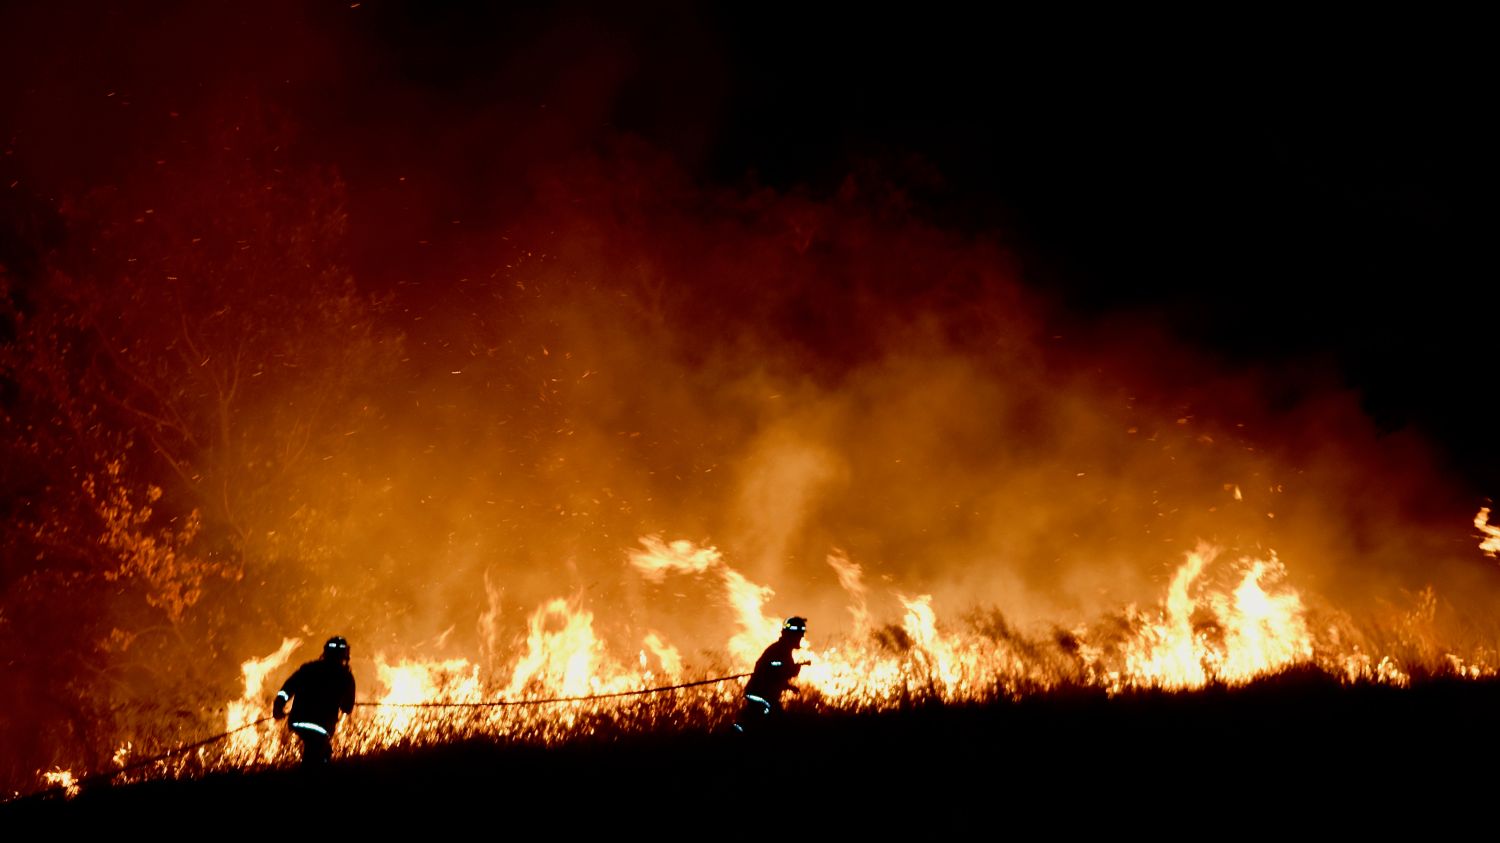

Australia is increasingly at risk of a range of natural disasters including tropical cyclones, bushfires, storms and floods. If unmanaged, these risks will significantly impact our resource and knowledge-led economy, and damaged homes, businesses and infrastructure and put lives at risk.
Our recent analysis for IAG found that more than a fifth of Australia's economic output is at high or extreme risk of disruption from cyclones and more than a quarter of national gross domestic output is located in areas with high to extreme risk of flooding. Further, $175 billion of national GDP is located in areas subject to bushfire, putting pressure on the government to raise its investment in mitigation infrastructure and planning.
As a general rule, one dollar spent on mitigation can save at least two dollars in recovery costs. The Australian Government currently spends three per cent of expenditure on mitigating natural perils and the remainder is spent on disaster relief and recovery efforts.
Our analysis at the local government area (LGA) level helps to identify LGAs that face the greatest risks.
The nature of risk and impact
Even if the risk of a natural peril is low, severe events can still occur. For example, South Australia is not at extreme risk of storm, but in 2016 had a one in a 50-year storm. The risk of a natural peril occurring is different from the impact. The risk rating is a function of the likelihood of an adverse event occurring based on a range of environmental factors, for example, the proximity of a property to a flood-prone river.
The actual impact of the natural perils relates to the scale of the event and mitigating factors such as land-use planning and building codes; where properties are located; building standards; and the protective infrastructure, such as levees, which can mitigate the impact. As such, the risk of being impacted by a weather event can be mitigated by planning, protective infrastructure and building standards. The level of possible mitigation varies according to the type of natural peril. For instance, infrastructure can be built to deal with heavy rain or flood but a similar infrastructure solution on is not available for bushfires.
Spatial aggregation of perils risks
The risk data shows the average risk levels for each property within an LGA. In each LGA it is possible that for some natural perils, the risk level would vary significantly. For example, for flooding, properties along a waterway would likely have a higher risk rating than other parts of the LGA which are on higher ground. Floods do not affect regions uniformly and can damage the same area repeatedly while not affecting properties very close by. Similarly, properties along the urban fringe can have a higher risk of bushfires than properties in built-up areas.
What the results say
Approximately 4.1 million people in Queensland live in LGAs with a high to extreme tropical cyclone risk. The Queensland LGAs of Brisbane, the Gold Coast, Townsville and Moreton Bay all contain communities deemed to be at high to extreme risk of tropical cyclones, storms and floods.
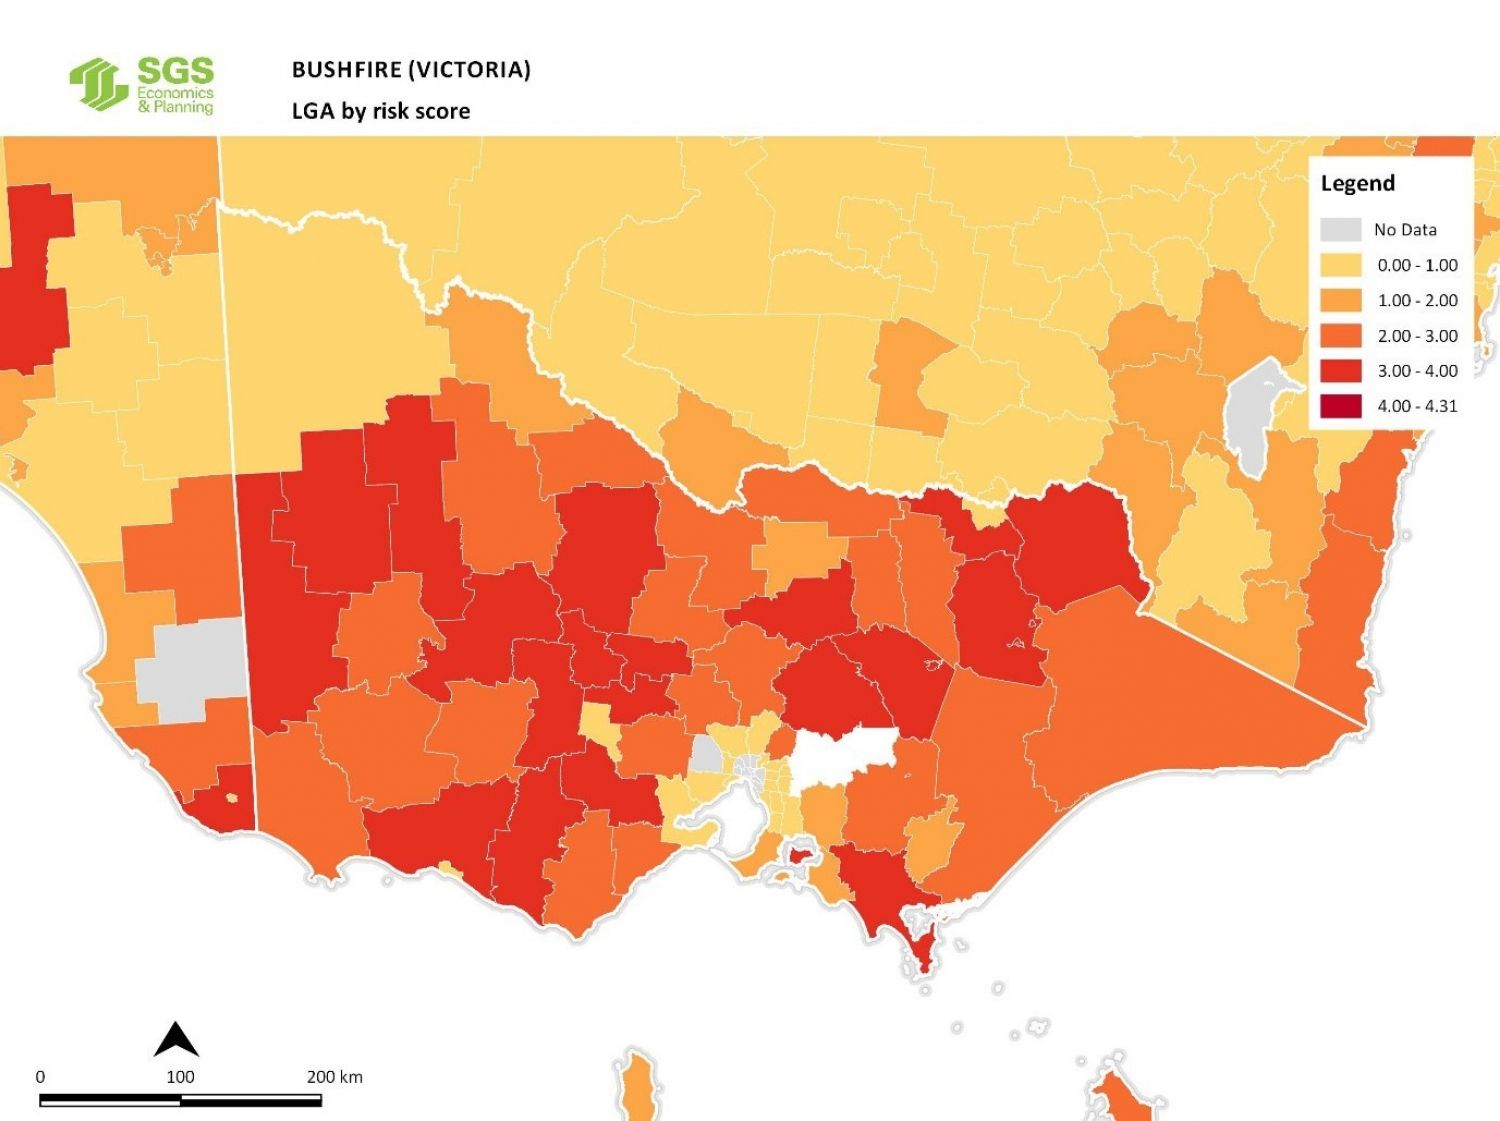
In Victoria, 17.2 per cent of the population live in LGAs which contain communities at high to extreme risk of bushfire. Hepburn, Central Goldfields and Hindmarsh LGAs in Regional Victoria are at high risk of bushfire. Even in Greater Melbourne, 221,000 people live in LGAs which are at high risk of bushfire. Figure 1 shows Victoria's fire risk.
Figure 1. Fire risk Victoria

Sydney has a high risk of floods with 1.4 million people living in LGAs at high and very high risk of flood. This is due to extensive development in the floodplains of the Hawkesbury, Georges and Cooks rivers and their various tributaries. In Regional NSW, 1.7 million people live in LGAs at high and very high risk of flood. This includes the LGAs of Lismore, Richmond Valley and Clarence Valley. Storms and flooding can impact agricultural and mineral production, urban transport systems and air travel. Recently public transport systems in Sydney and Melbourne have experienced delayed services due to heavy rains. Heavy rainfall also impacts the road network via reduced speeds, areas of flooding and more accidents. Air travel can also be heavily impacted by storms. This does not significantly damage the infrastructure but disrupts short term activity.
Implications
Much of the Australian population is at some form of natural peril. Since settlement, a number of options have been taken on an ad hoc basis to try to manage the impacts of natural disasters including relocating the population from heavily exposed areas; implementing land-use planning strategies to direct growth to lower risk areas; and constructing levees and dams to minimise the impact of flooding.
Yet without a consistent, long-term and national approach, large parts of the country including the most populated or economically valuable, remain exposed to natural perils.
Recent economic analysis has highlighted that successive governments have overinvested in post-disaster reconstruction and underinvested in mitigation that would limit the impact of natural disasters on our economy and communities.
As a general rule, one dollar spent on mitigation can save at least two dollars in recovery costs. The Australian Government spend on mitigation measures is equivalent to three per cent of what it spends on recovery and rebuilding efforts.
The rebalance of this spending allocation is a national priority. Investment in mitigation strategies reduces the cost of reconstruction and safeguards our communities. A safer future does not just depend on the government. Individuals and communities also have what the Royal Commission into Victoria’s bushfires calls a ‘shared responsibility’.
While all levels of government, including emergency services and land use planning and building regulators, should take steps to improve protective infrastructure, individuals and businesses need to be educated and empowered to take more responsibility for their own safety.
Without heightened awareness, appropriate information and a co-ordinated, long-term approach to managing risks, individuals, businesses and government will remain exposed and our future economic strength and stability will be at risk.
Key findings
Our analysis found:
- Areas of key economic importance at high to extreme risk include large parts of our mining industry and knowledge economy hubs in the major Central Business Districts (CBDs).
- $326.6 billion worth of GDP (20.3 per cent of the Australian economy) and 3.9 million people (17.3 per cent of the population) are in LGAs with a high to extreme risk of tropical cyclones. Recent tropical cyclones have significantly impacted on mineral and agricultural production.
- 28.4 per cent of GDP ($425.5 billion) and 24.9 per cent of the population (5.5 million people) are living in LGAs with high to extreme flood risk. The Queensland floods in 2011 illustrated the disruption to the region’s economic activity and highlighted how a community’s economic capacity impacts its ability to respond and rebuild following natural disasters.
- Parts of the Melbourne CBD and its 450,000 workers are at very high risk of flood. Flooding has impacted on the transport network in the Melbourne CBD several times recently causing economic disruption.
- The 500,000 workers in the Sydney CBD have experienced transport disruptions caused by storms in recent years.
- LGAs with high and extreme risk of bushfire generated $175 billion (10.8 per cent) of GDP and are home to 2.2 million people (9.2 per cent of the population).
- LGAs with high and extreme risk of earthquakes generate $853 billion, or 52.5 per cent, of Australia's GDP and house 58 per cent of our population.
Summary tables
The summary tables below present the 2017 LGA Population by risk level for four natural perils (bushfire, flood, storm and tropical cyclone) for New South Wales, Victoria and Queensland. The risk ratings are useful in comparing areas for the same peril (e.g. comparing flood risk between two LGAs), however, the risk ratings for the various natural perils are not comparable to each other. That is, the risk or potential impact of an earthquake in an extreme risk area is not the same as an extreme risk for bushfires.
Bushfire Risk - LGA Population by risk level
| Greater Sydney | Rest of NSW | Greater Melbourne | Rest of Vic | Greater Brisbane | Rest of QLD | |
| Extreme | - | - | - | - | - | - |
| Very High | - | 9,000 | - | 243,000 | - | - |
| High | 317,000 | 240,000 | 222,000 | 625,000 | - | 1,000 |
| Medium | 484,000 | 1,115,000 | 266,000 | 198,000 | 222,000 | 770,000 |
| Low | 2,781,000 | 1,350,000 | 2,823,000 | 480,000 | 2,181,000 | 1,586,000 |
| No exposure | 1,440,000 | 18,000 | 1,466,000 | - | - | 38,000 |
Flood Risk - LGA Population by risk level
| Greater Sydney | Rest of NSW | Greater Melbourne | Rest of Vic | Greater Brisbane | Rest of QLD | |
| Extreme | - | - | - | - | - | - |
| Very High | 66,000 | 289,000 | - | 66,000 | - | 30,000 |
| High | 1,280,000 | 1,427,000 | 160,000 | 171,000 | 1,439,000 | 632,000 |
| Medium | 1,539,000 | 847,000 | 738,000 | 906,000 | 810,000 | 1,678,000 |
| Low | 1,264,000 | 117,000 | 1,170,000 | 370,000 | - | 1,000 |
| No Exposure | 769,000 | 20,000 | 2,708,000 | 34,000 | 154,000 | 23,000 |
Storm Risk - LGA Population by risk level
| Greater Sydney | Rest of NSW | Greater Melbourne | Rest of Vic | Greater Brisbane | Rest of QLD | |
| Extreme | - | - | - | - | - | - |
| Very High | - | - | - | - | - | 1,000 |
| High | - | 133,000 | - | - | - | 28,000 |
| Medium | 506,000 | 1,458,000 | - | 52,000 | 1,954,000 | 1,096,000 |
| Low | 4,516,000 | 1,141,000 | 4,766,000 | 1,494,000 | 448,000 | 1,270,000 |
| No Exposure | - | - | - | - | - | - |
Tropical Cyclone Risk - LGA Population by risk level
| Greater Sydney | Rest of NSW | Greater Melbourne | Rest of Vic | Greater Brisbane | Rest of QLD | |
| Extreme | - | - | - | - | - | 610,000 |
| Very High | - | 95,000 | - | - | 602,000 | 1,266,000 |
| High | - | 152,000 | - | - | 1,568,000 | 97,000 |
| Medium | - | 166,000 | - | - | 232,000 | 119,000 |
| Low | - | 482,000 | - | - | - | 296,000 |
| No Exposure | 502,000 | 1,838,000 | 4,776,000 | 1,546,000 | - | 7,000 |
Download report and data
Connect with us on LinkedIn
- Local government
- State government
- Federal Government