Effective Job Density: comparing our regions and cities
Effective Job Density: comparing our regions and cities
Click on the interactive map above, to zoom in and see the rank of any location in Australia.
Australia has been transitioning from an economy dependent on manufacturing, mining and agriculture to one driven by professional services that include finance, engineering, IT, lawyers and the university sector. This is not to say that manufacturers, miners and farmers will disappear. Rather, they will be required to be highly innovative to prosper and this will demand, directly or indirectly, heavy involvement by professional services. Likewise, population serving sectors like retail, health and hospitality will require access to these analytical and creative services if they are to boost productivity.
These structural trends are often described as the shift towards the ‘knowledge economy'. Spatially, this shift has meant that an increasing share of Australia’s wealth and employment creation is reliant on ‘big city’ based business services. For example, we often think of the mining activity as taking place in regional areas. But in fact, around 40% of the economic output of the mining sector is actually based in our major metropolitan centres.
Despite the higher rents and congestion, professional services cluster in these locations, because, on balance, these crowded locations provide a competitive advantage. Access to skilled labour, complementary services and a larger customer base are all virtues of our major metropolises for individuals and firms providing professional services. Furthermore, large cities provide greater opportunity for formal and informal knowledge transfers and ensure that firms are abreast of new trends, technologies and business practices, promoting innovation, efficiency and increased productivity.
The concentration or ‘agglomeration’ of these services improves their capacity for innovation and therefore their ability to boost the competitiveness of their customers.
So how do we determine how ‘agglomerated’ a location is? Or how one location compares relative to another competing location?
Often social scientists and economists will look at total employment numbers to gain an understanding of this. For example, Sydney has 2 million jobs, while Perth has 800,000 jobs. Therefore, Sydney is larger and should also be denser and provide more of these agglomeration benefits. However, we know there is great variation across our cities, which have high density CBDs with sprawling suburbs around them. A simple density measure (jobs per hectare) can improve on this and highlight where these employment agglomerations occur across a city.
However, you don’t just have to be IN a dense location to gain an advantage. Being near to one, or multiple, is just as beneficial. This is why we have seen strong demand for development within our established urban areas and rapid growth in settlements on the fridge of our big cities. While they are relatively low density themselves, they are just a short trip away from denser employment nodes.
SGS has developed a spatial index of this agglomeration phenomena which is referred to as Effective Job Density or EJD. EJD is a measure of the relative concentration of employment, derived from the density and accessibility of all jobs across a region. The region might be a city or, in this case, the entire Australian continent. The ‘National EJD’ of a specific area provides a relative rank of how agglomerated one location is, compared to any other location in the country. It is calculated using two variables:
- Car travel time from location a to location b - calculated using actual road networks
- Number of jobs at location b - sourced from 2011 Census.

For a metropolitan area’s EJD calculations, public transport travel times are also often included.
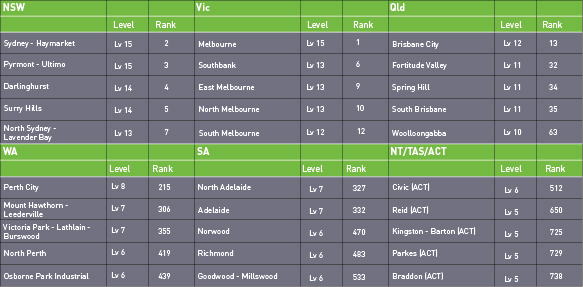
SGS has mapped EJD by 15 broad levels across Australia. Each of the 2193 ABS Statistical Areas 2s (SA2s) have also been individually ranked, nationally and within their respective state. The Table below shows the top five locations in each state along with their national ranking.
TABLE 1 TOP EJD LOCATIONS IN EACH STATE, WITH NATIONAL RANKING
The chart below also illustrates how recent population and employment growth (from 2006 to 2011) is distributed under the 15 EJD levels.
POPULATION AND JOBS GROWTH BY EJD LEVELS, 2006 TO 2011
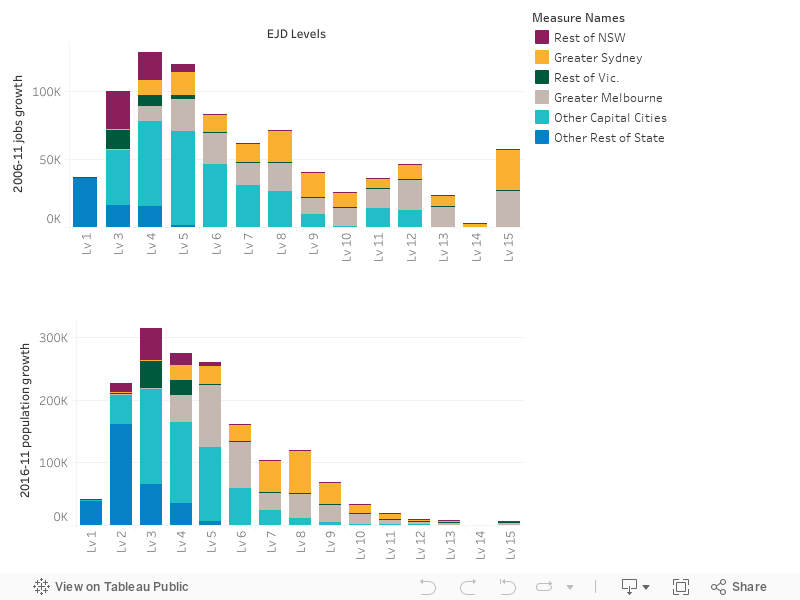
At a broad level, mapping National EJD highlights the concentration of employment on the eastern seaboard, with the capital cities and regional centres along this coastline forming a ‘mega network’. Combined, this corridor represents over 50 per cent of Australia’s economic output. Population and more so, employment, is increasingly attracted to this economic mass and the associated increased opportunities and productivity improvements that come with it. The top five EJD levels represent less than 0.001 per cent of Australia’s land mass, yet they have captured 20 per cent of jobs growth and 5 per cent of population growth from 2006 to 2011 (see chart). A significant portion of those new jobs are in Level 15, which consist of just the Melbourne CBD (ranked 1 in Australia) and Sydney CBD and surrounds (ranked 2 and 3 in Australia).
Zooming into the map shows that each of the major metropolitan cities has an influence well beyond its urban boundaries. As a result these peri-urban areas have managed to capture much of Australia’s regional employment and population growth by providing a country lifestyle while also ensuring strong links back to the broader economy. Many of the peri urban settlements of Sydney and Melbourne provide a rural lifestyle, yet are ranked higher than urban parts of other major cities such as Hobart, Darwin or even Adelaide and Perth.
Looking more closely at Brisbane and Perth, which are of similar size (1 million and 800,000 jobs respectively), we can see that Brisbane ranks significantly higher on the National EJD index. This is due to Brisbane’s denser central CBD and access to a broader network of centres in South East Queensland along the eastern seaboard. The Brisbane CBD is ranked 13 nationally - compared to Perth’s CBD which is ranked 215.
Zooming further into the map shows the bright agglomeration core, particularly evident in Melbourne and Sydney. The CBDs of these two cities have significantly higher EJD, effectively ‘off the chart’ compared to the rest of Australia’s spatial economic landscape. They are increasingly competing economically on an international scale.
However, as our big cities expand, their fringes become increasingly further away from their central cores. As a result, many major regional centres are becoming relatively more competitive than these growth area locations. Newcastle also provides a higher EJD rank than many outer parts of Sydney. In Victoria, Geelong and Ballarat provide a level of EJD similar to growth areas of Melbourne. The Gold Coast in SEQ also ranks higher than many outer parts of Brisbane and with a strong lifestyle offer could increasingly become an attractive alternative.
While not the only driver, EJD – or agglomeration – is increasingly a core driver of the new knowledge economy, which is in turn attracting other employment and people seeking job opportunities.
The next edition of Urbecon will look to break down EJD by sector to see how different parts of our economy are spatially distributed and which are more affected by agglomeration.